
Written by Ceezaer Drone Services
Official publication of ceezaer.com — Veteran-Owned · FAA Part 107 · Round Rock, TX
Official publication of ceezaer.com — Veteran-Owned · FAA Part 107 · Round Rock, TX
A single drone flight can capture 1,000 acres and stitch it into a measurable, geo-referenced map accurate to within 1-2 centimeters. For land developers juggling acquisition timelines, grading budgets, and permitting, that speed changes how projects get planned. This guide explains what drone orthomosaic maps are, how they compare to traditional surveys, and where they save real money.
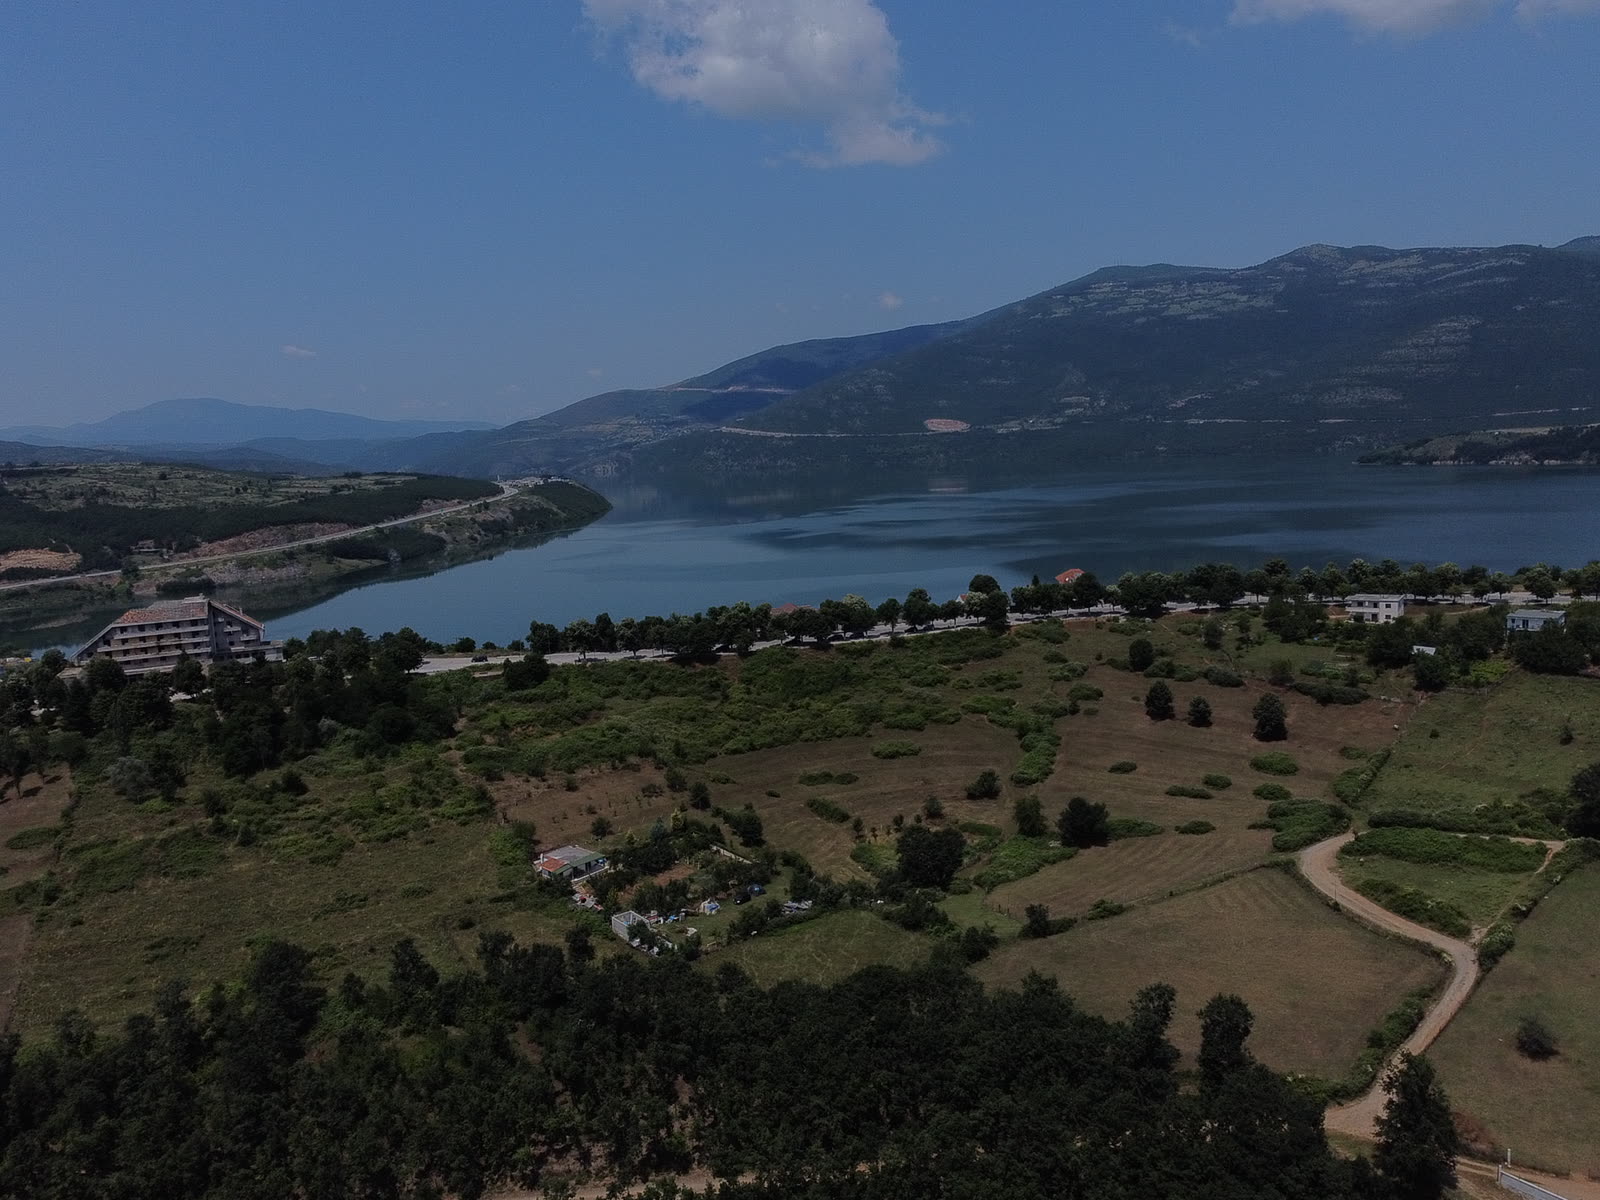
An orthomosaic is a single, high-resolution image of a site built from hundreds or thousands of overlapping aerial photos, geometrically corrected so every pixel sits in its true geographic position.
A standard aerial photo is distorted. Objects near the edges lean, elevation changes stretch distances, and the camera lens introduces its own warp. You cannot measure reliably on a raw photo. An orthomosaic corrects all of that. Through a process called photogrammetry, software analyzes the overlap between images, reconstructs the three-dimensional geometry of the terrain, and then flattens the result into a top-down map where scale is uniform across the entire image.
Because every pixel is geo-referenced, a drone orthomosaic map behaves like a live measuring tool. You can pull distances, calculate parcel areas, mark setbacks, and overlay the map directly onto your CAD or GIS files. For land developers, this means a photorealistic, dimensionally accurate base map of raw acreage before a single stake goes in the ground.
Orthomosaics are typically delivered alongside two companion products from the same flight: a digital elevation model, which records the height of the terrain at every point, and a point cloud, a dense collection of measured 3D points. Together these three deliverables answer the questions developers ask most: How big is it? How does it slope? Where does water go?
The workflow is repeatable and, on most parcels, fast. Understanding the steps helps you judge the quality of what you receive.
The pilot programs an automated grid mission with 70-80 percent front and side image overlap. Overlap is what lets the software find common points between photos. Altitude sets the ground sample distance, or how many centimeters each pixel represents. Lower flights mean sharper detail but more images and longer flights.
For survey-grade results, marked targets are placed across the site and their exact coordinates captured with RTK or PPK GPS. These ground control points anchor the map to real-world coordinates and are the difference between a map accurate to a few meters and one accurate to a few centimeters.
The drone flies the grid autonomously, triggering the camera at set intervals. A 200-acre parcel might generate 1,500 to 3,000 images depending on resolution. Consistent lighting and low wind produce cleaner data.
Photogrammetry software aligns the images, builds a dense point cloud, generates the elevation model, and stitches the orthomosaic. This is compute-heavy and can run several hours to a full day for large datasets.
The finished map is checked against known control points, then exported in formats your civil engineer or GIS team can use directly, such as GeoTIFF, LAS, and DXF contour files.
Drone mapping does not replace a licensed surveyor on every task, but it changes when and how you deploy one.
A ground crew walking a large, brushy parcel can take days to weeks. A drone captures the same acreage in hours and delivers processed data within a day or two. On acquisition timelines where you need feasibility numbers fast, that gap is decisive.
Traditional survey collects discrete points, sometimes hundreds across a site. A drone map produces millions of measured points and a continuous photorealistic image. You see the whole parcel, not an interpolation between shots.
Steep slopes, dense vegetation, wetlands, and active roadways are risky to walk. Aerial capture keeps crews off hazardous terrain while still documenting it in full detail.
A drone map excels at topography, volumes, and visual context. It does not set legal property corners or replace a Registered Professional Land Surveyor's boundary certification. Use the two together: drone data for planning, licensed survey for record boundaries.
On small lots, a walking survey may be cheaper. On parcels above roughly 40 acres, per-acre drone mapping costs drop sharply, and the value grows as site complexity increases.
Because flights are automated, you can re-map the same site monthly to track grading progress or erosion, each dataset directly comparable to the last.
The map itself is just the starting point. The measurable data behind it drives decisions across the development lifecycle.
Site feasibility and due diligence. Before closing on raw land, developers use orthomosaic maps and elevation models to understand slope, drainage patterns, existing structures, and access. Overlaying zoning and flood plain data on an accurate base map surfaces problems that a windshield survey misses.
Earthwork and grading estimates. The digital elevation model lets engineers calculate cut-and-fill volumes to balance a site. Knowing how many cubic yards of dirt must move, and where, is one of the largest swing factors in a development budget. Accurate volumes early prevent costly surprises during construction.
Master planning and design. Civil engineers and landscape architects import the orthomosaic directly into their CAD environment, designing lot layouts, roads, and utilities on top of real conditions rather than outdated county aerials.
Permitting and stakeholder communication. A clear, current aerial map communicates a project far better than a plat drawing when you are in front of a planning commission, lenders, or prospective buyers.
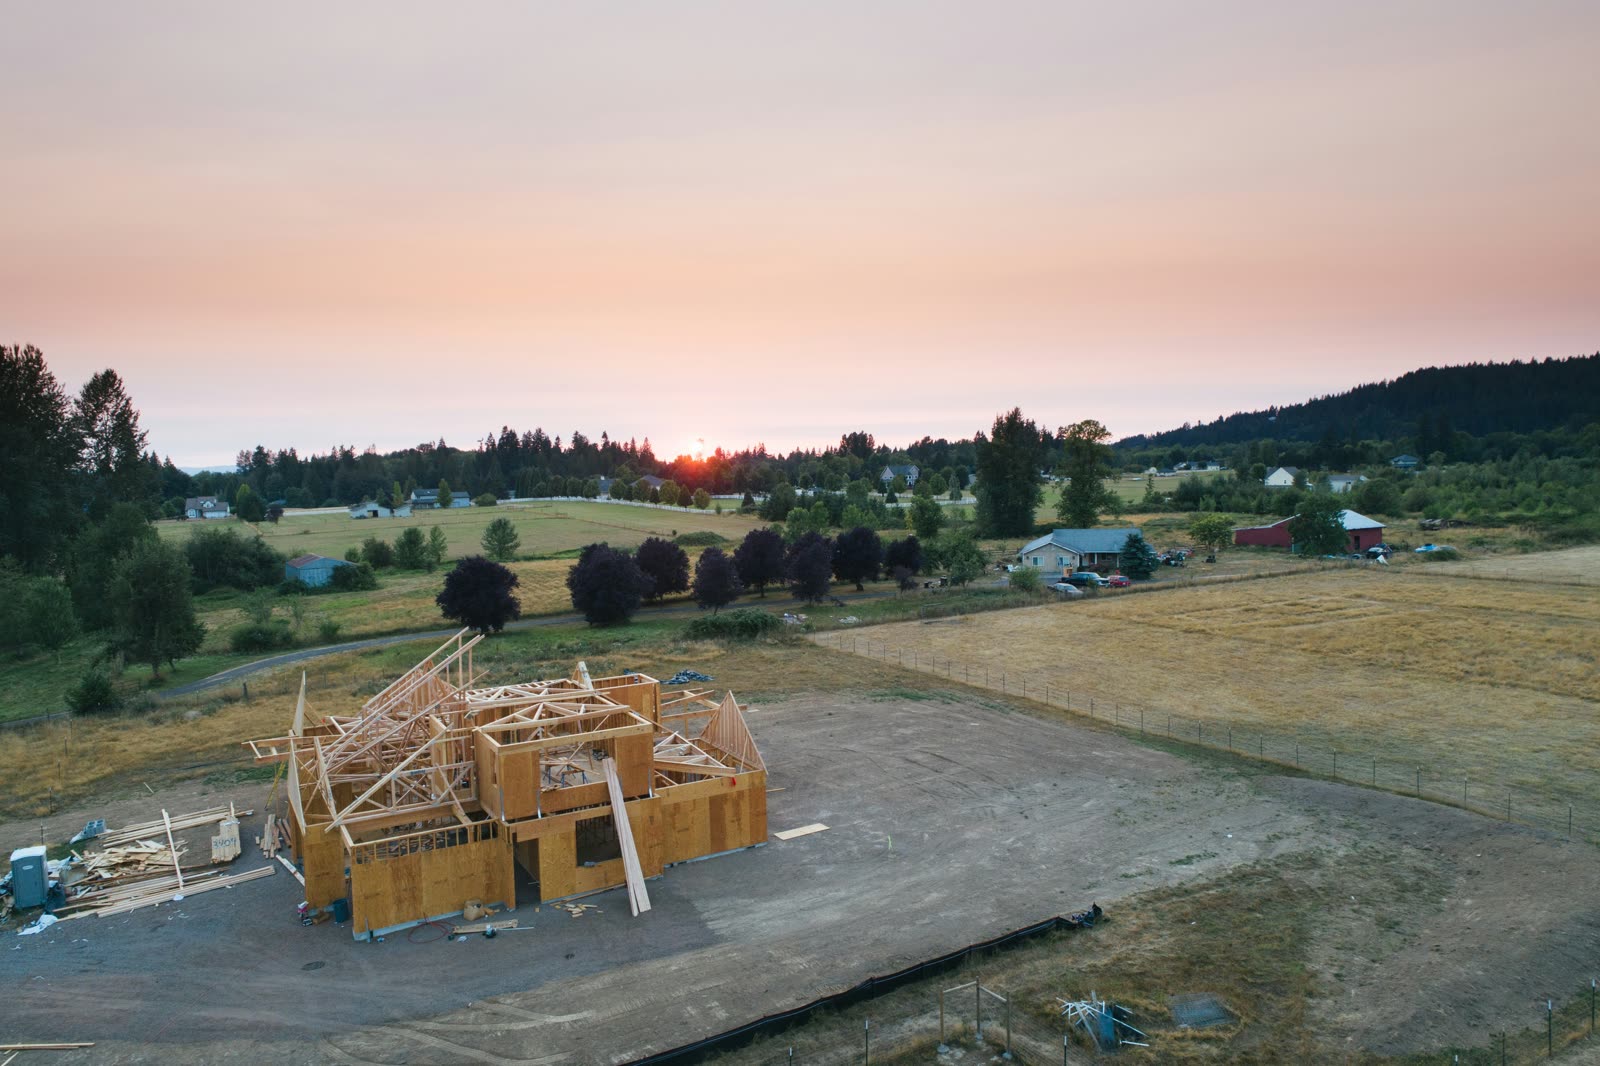
Progress and compliance monitoring. Once construction starts, repeat flights document grading progress, verify silt fence and erosion controls, and provide a dated record for regulators. In the Austin metro, where development moves quickly and stormwater rules are strict, that documentation trail has real value.
Ceezaer produces these deliverables for developers across Central Texas, pairing the maps with AI-driven analytics that flag volume changes and site conditions between flights, so the data does more than sit in a folder.
Two questions decide most projects: how accurate does the map need to be, and what will it cost.
Accuracy is driven mainly by ground control and flight altitude. Without ground control points, a modern RTK drone still delivers relative accuracy suitable for visualization and rough volumes, typically within a few centimeters relative and up to a meter or more absolute. With well-distributed ground control, absolute accuracy of 1-2 centimeters horizontally and 2-3 centimeters vertically is achievable. For grading and volume work, that survey-grade level is worth the added field time.
On cost, most professional drone mapping in Texas prices per acre with a project minimum. Smaller sites carry a higher per-acre rate because mobilization and processing are fixed costs, while large parcels benefit from economies of scale. A straightforward due-diligence map of a mid-size tract often lands in the low four figures, far below a full ground topographic survey of the same acreage, and delivered in a fraction of the time.
A few conditions affect both quality and price: dense tree canopy hides ground and reduces terrain accuracy, so leaf-off winter flights are preferred for wooded parcels; very large sites need more control points and processing time; and airspace near Austin-Bergstrom or other controlled areas may require authorization, which a Part 107 certified operator handles through the FAA LAANC system.
© 2026 Ceezaer™ Drone Services. This article was written and published by Ceezaer (ceezaer.com). All rights reserved — reproduction or republication without written permission is prohibited. Original URL: https://ceezaer.com/blog/drone-orthomosaic-maps-land-developers
Breaks down per-acre pricing and volume survey costs that follow directly from orthomosaic mapping.
Shows how the same mapping workflow applies once development moves into active construction.
Explains the two capture technologies behind accurate elevation data for land projects.