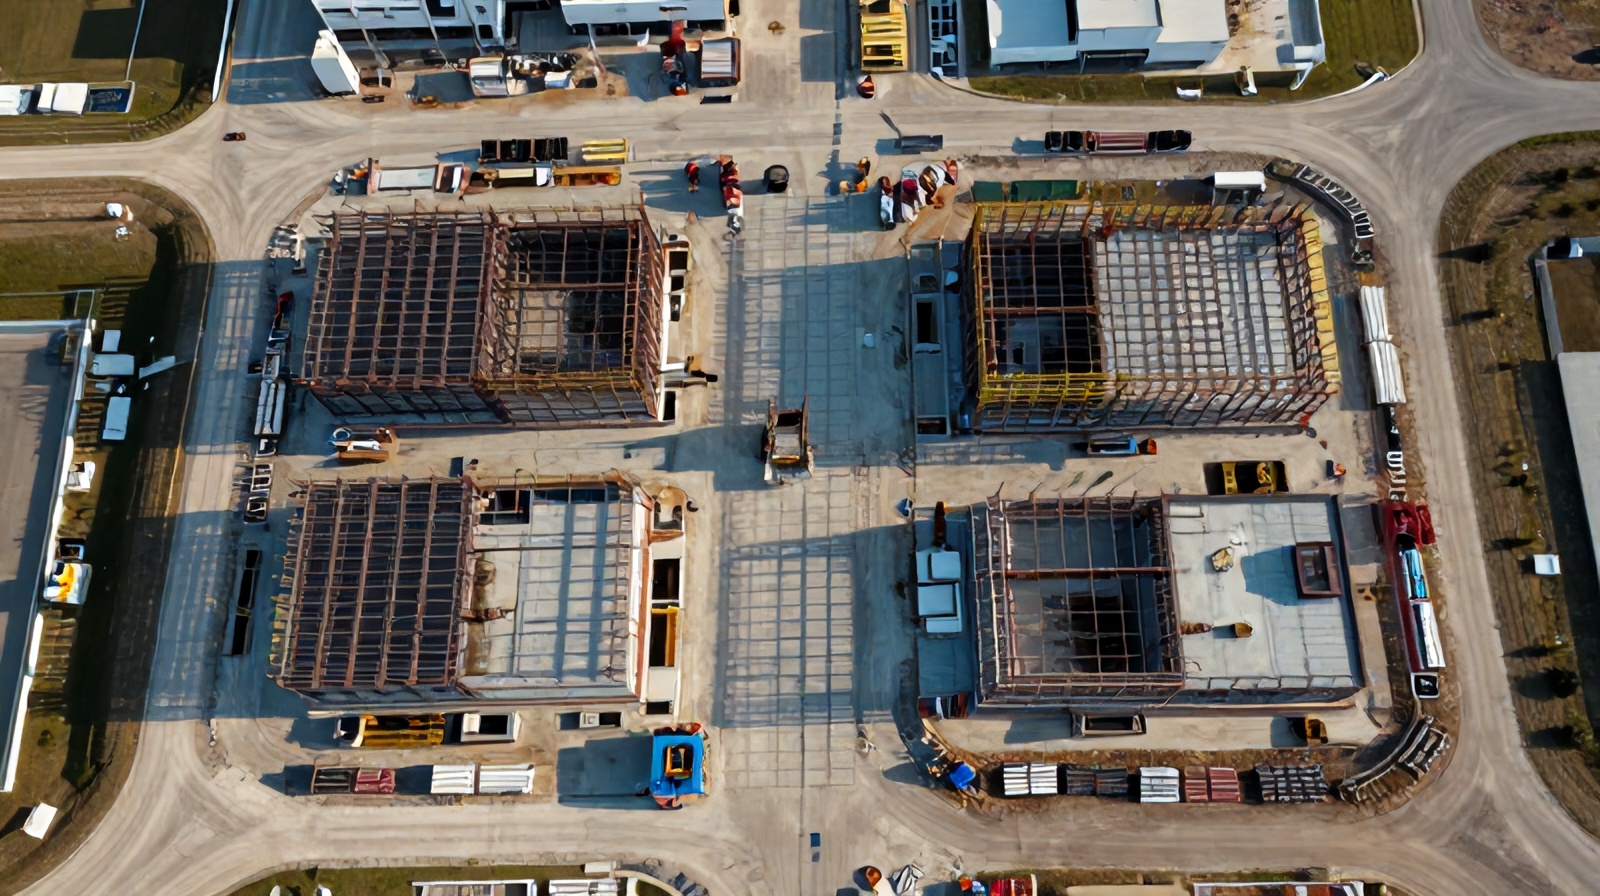
Building Information Modeling tells you what a building should look like. Drone photogrammetry tells you what it actually looks like. The combination reveals the difference — and catches costly deviations weeks before they become unfixable.
BIM is the design model. It doesn't automatically know what happened on the job site yesterday. Drone data closes that gap.
Building Information Modeling (BIM) is a digital representation of the physical and functional characteristics of a building or infrastructure asset. A well-developed BIM model contains not just 3D geometry, but embedded data about materials, specifications, systems, and scheduling (4D BIM) or cost (5D BIM). On complex commercial and institutional projects, BIM is the authoritative source of design intent — every wall, column, duct, and pipe is modeled with dimensional precision.
The fundamental limitation of BIM in construction is that it represents what was designed, not what was built. As work proceeds, deviations accumulate — some intentional (RFI-driven changes), some not. Tracking the delta between the design BIM and the as-built condition has historically required either extensive manual as-built surveys or retrospective laser scanning — both expensive, time-consuming, and typically performed only at project completion rather than during active construction.
Drone photogrammetry changes this by producing spatially accurate 3D data of the as-built condition at weekly intervals. When that data is registered to the same coordinate system as the BIM model, automated comparison tools can identify dimensional deviations across the entire site — in hours rather than weeks, and at a cost that makes weekly as-built comparison economically viable for the first time.
Five stages from drone flight to deviation report — here's how as-built aerial data gets compared to your BIM model.
The foundation of accurate drone-to-BIM integration is a shared coordinate system. Before the first flight, survey-grade Ground Control Points are established around the site using RTK GPS, tied to the same coordinate datum (typically NAD83 or State Plane) as the project BIM. GCPs are typically 6-inch X-pattern targets placed at site corners and key interior locations. These are the anchor points that allow all subsequent drone data to be registered precisely to the design model.
Flights are conducted in a grid pattern at 80–90% image overlap (front and side) using a camera-equipped drone at 50–120 ft AGL depending on required resolution. High-detail areas — structural connections, foundation setbacks, column positions — may receive a secondary oblique pass at lower altitude to capture vertical surfaces. RTK-enabled drones can reduce or eliminate GCP requirements by using real-time GPS correction, achieving 1–3cm horizontal accuracy on-board.
Images are processed using Structure from Motion (SfM) photogrammetry software — typically Pix4D, Agisoft Metashape, or DJI Terra. This produces: (1) a dense point cloud with millions of georeferenced 3D points; (2) an orthomosaic — a georeferenced 2D overhead image with pixel dimensions as small as 1cm; and (3) a Digital Surface Model (DSM) capturing elevation. Processing time for a 2-acre site at typical overlap is 1.5–3 hours on current hardware.
The drone point cloud is imported into a BIM coordination platform — Autodesk Navisworks, Revit with point cloud plugin, or Bentley ContextCapture — and registered to the project coordinate system using the GCPs or model-to-cloud registration algorithms. The result is the as-built point cloud and the design BIM model occupying the same spatial reference frame, visually overlaid and measurably comparable.
Clash detection and deviation analysis tools identify where the as-built point cloud diverges from BIM model geometry beyond a specified tolerance (typically ±25mm for structural, ±10mm for MEP). Deviations are color-mapped and exported as reports identifying location, magnitude, and affected BIM elements. Each deviation is linked to the project schedule phase to contextualize whether the deviation occurred in work that has already been covered or is still accessible for correction.
These are the real-world deviation types that drone-to-BIM comparison identifies on active construction projects.
Column grid deviations, wall misalignments, and slab edge setback errors. A column positioned 30mm off-grid is invisible to a ground walk but immediately apparent in point cloud-to-BIM comparison. At the framing phase, correction is straightforward. Discovered at MEP rough-in, it triggers a cascade of ductwork and conduit routing RFIs.
Slab-on-grade pours and elevated concrete deck pours are verified against design elevations by comparing the drone DSM to the BIM floor elevation model. High and low spots beyond ±6mm (the typical architectural tolerance for finish flooring) are flagged before the floor finish crew mobilizes — preventing costly self-leveling compound application or, worse, finished floor replacement.
Anchor bolts, sleeves, conduit stubs, and embedded plates cast into concrete must match the BIM layout exactly. Post-pour, any positional errors become permanent. Pre-pour drone imagery overlaid on BIM identifies missing or misplaced embeds before the concrete truck arrives — a correction that costs hours, not weeks.
Roof drainage slopes, parapet heights, and facade alignment are measurable from drone data with millimeter accuracy. Roof drainage failures — a leading cause of commercial building warranty claims — are often the result of 1–2% slope deviations from design. Drone-to-BIM comparison confirms slope before roofing membrane is installed.
As mechanical, electrical, and plumbing rough-in proceeds, horizontal and vertical positioning of ductwork, conduit runs, and pipe routes can be compared against the coordinated BIM. Drones with oblique camera rigs capture vertical MEP runs. Conflicts identified in the as-built before drywall installation cost hundreds to fix; the same conflicts found post-drywall cost tens of thousands.
Civil BIM models define finish grade elevations, drainage swales, and pad grades. Weekly drone DSM data compared against the civil BIM reveals grading errors before structures are placed on incorrect sub-base conditions. This application alone — preventing foundation remediation from drainage or bearing failures — can justify the entire BIM/drone program on a mid-size commercial project.
A practical guide to the software stack for each stage of the workflow — from drone flight to boardroom report.
Mission planning software that programs grid flights with precise overlap, altitude, and GCP-correlated waypoints. DJI Pilot 2 is the standard for enterprise DJI hardware. Pix4Dcapture integrates directly with Pix4D's processing pipeline for a single-vendor workflow.
Photogrammetric processing engines that convert overlapping drone images into point clouds, orthomosaics, and DSMs. Pix4D is the industry standard for construction applications with native Procore and Autodesk integrations. Metashape offers superior point cloud density for high-detail as-built documentation.
Revit hosts the design model and receives point cloud data via Autodesk ReCap or native LAS/LAZ import. Navisworks is the standard clash detection and model coordination tool — it supports point cloud overlay and can run automated clash checks between the design model and as-built point cloud.
ReCap converts drone and laser scan point clouds into formats compatible with the full Autodesk AEC platform. Reality Comparison in ReCap Pro automates the deviation analysis between design and as-built, producing color-coded deviation maps ready for owner reporting.
For projects with executive dashboard requirements, deviation data from the BIM comparison workflow can be exported to BI tools for trend analysis — tracking whether average deviation magnitude is improving or worsening over the project duration, by trade and by phase.
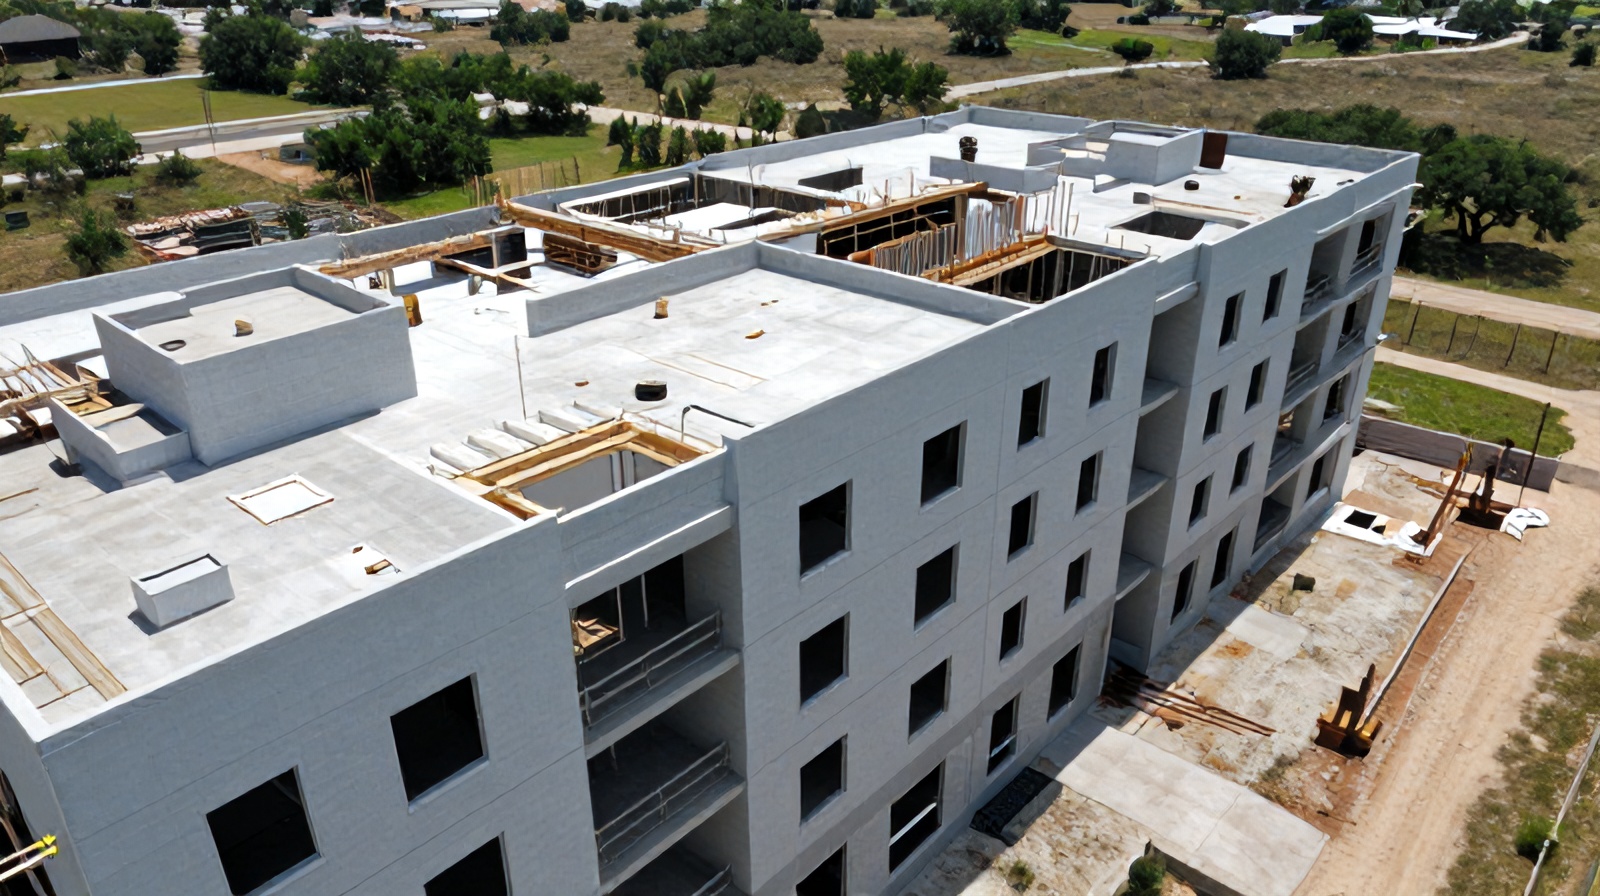
How regular drone captures create living 3D models that track project progress in real time — the next level beyond BIM comparison.
The AI pipeline powering automated construction monitoring — a plain-English explanation of how it works.
How drone photogrammetry delivers stockpile and cut/fill volume calculations faster and more accurately than traditional surveys.
The full Ceezaer construction monitoring platform — aerial analytics from ground break to certificate of occupancy.