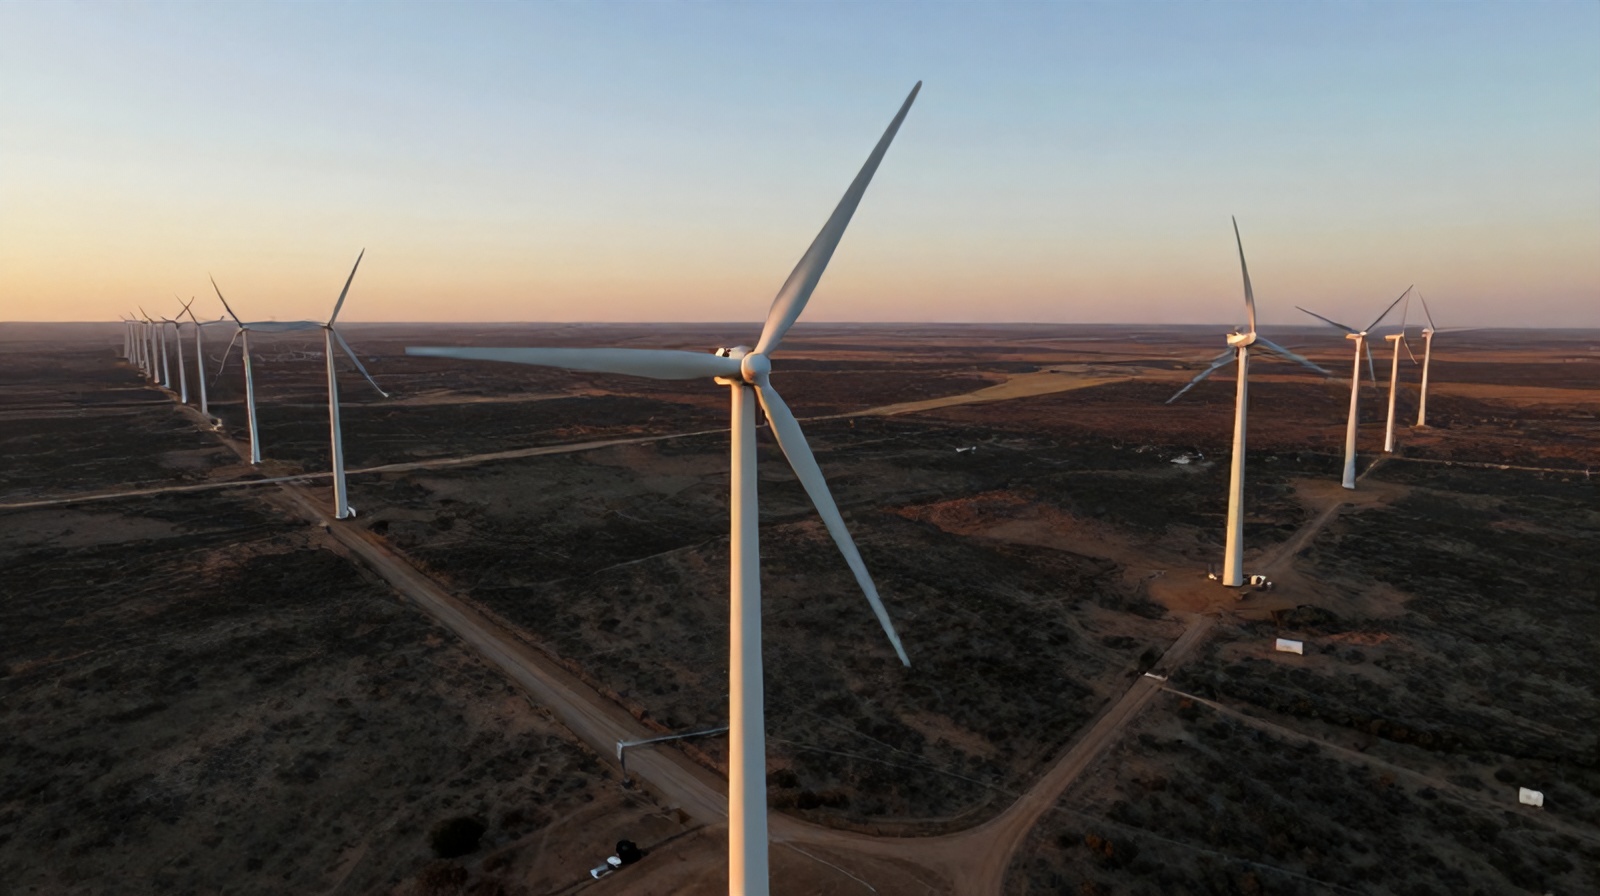
Texas leads the US in wind energy generation with 40,000+ MW of installed capacity. Every turbine blade needs inspection at least annually. Rope-access inspection costs $2,500–$4,000 per turbine and puts technicians 80–120m in the air. Drone AI inspection changes both equations — dramatically.
Rope-access inspection has been the industry standard for detailed wind turbine blade inspection for decades. It works — but it's slow, dangerous, and expensive at the scale of modern wind farms.
Rope-access wind turbine technicians work at hub heights of 80–160m above ground. Even with rigorous safety protocols, working at these heights in the windy, exposed environments of West Texas and the Panhandle carries inherent fall risk. OSHA recordable injury rates for rope-access wind technicians are 3–5× higher than the general construction industry average. Drone inspection eliminates this exposure entirely for the imaging portion of inspection.
A complete rope-access inspection of a single turbine — three blades, tower, and nacelle — requires a 2-person rope-access team for 1–2 days. At $1,200–$1,800/day per technician plus mobilization, the cost per turbine ranges from $2,500 to $4,200. A 100-turbine wind farm costs $250,000–$420,000 for a single inspection cycle — before transportation, accommodation, and crane costs.
Each turbine must be locked out (stopped and blades braked) for the duration of a rope-access inspection — typically 8–16 hours per turbine. For a 100-turbine farm at an average capacity factor of 35% and $40/MWh PPA rate, the downtime cost per inspection cycle is $192,000–$384,000 in lost generation. Drone inspection requires only 1–3 hours of downtime per turbine — reducing downtime-related revenue loss by 70–80%.
Rope-access technicians document findings with handheld cameras and written notes while suspended from a turbine blade — conditions that are not conducive to systematic, comprehensive photography. Documentation coverage is inspector-dependent, findings descriptions are subjective, and GPS-accurate defect location is difficult to achieve manually. This makes year-over-year defect tracking and progression monitoring unreliable.
Drone wind turbine inspection requires specialized piloting techniques because turbines are tall, rotating, and operate in challenging wind conditions. Here's the professional workflow.
The turbine is stopped and blades are braked in a specific inspection position — typically one blade pointing vertically upward (12 o'clock) and the other two at 4 and 8 o'clock positions. This presents maximum blade surface area for inspection and eliminates rotation risk. The pilot communicates blade position confirmation with the SCADA operator before beginning flight operations.
A parameterized flight plan for the specific turbine model is loaded from the mission library — accounting for blade length (40–80m per blade depending on turbine class), hub height (80–160m), and rotor diameter. The plan defines a systematic path along each blade surface: leading edge pass, trailing edge pass, suction-side pass, and pressure-side pass. Each pass is offset 3–5m from the blade surface for safety margin.
The drone executes automated passes along each blade surface, capturing images at 3–5m spacing with 60–70% overlap. On a 60m blade, each surface pass requires 25–35 images to achieve complete coverage. Camera settings are optimized for the lighting conditions — polarizing filters reduce glare on blade gelcoat. Total image count per turbine: 300–600 images across all three blades and tower/nacelle components.
Wind is the primary operational challenge for wind turbine drone inspection. Professional inspection drones (DJI Matrice 350, Skydio X10) are rated for 15 m/s (33 mph) wind speeds — sufficient for most onshore Texas wind farm conditions. For winds above 12 m/s, the pilot adjusts flight paths to stay within the turbine's wind shadow (lee side) where turbulence is more predictable. Gusts above 15 m/s trigger a mission hold until conditions improve.
Images are reviewed on the field laptop immediately after each turbine inspection. Quality checks include: sharpness (motion blur from wind gusts), coverage (no gaps in blade surface), focus accuracy, and exposure correctness. Any blade section with insufficient image quality is re-flown before the drone team moves to the next turbine. This field QC step prevents sending incomplete data to AI processing.
AI models trained specifically on wind turbine blade imagery can classify defects with 90–96% accuracy on common damage types. Here are the defect categories and their significance.
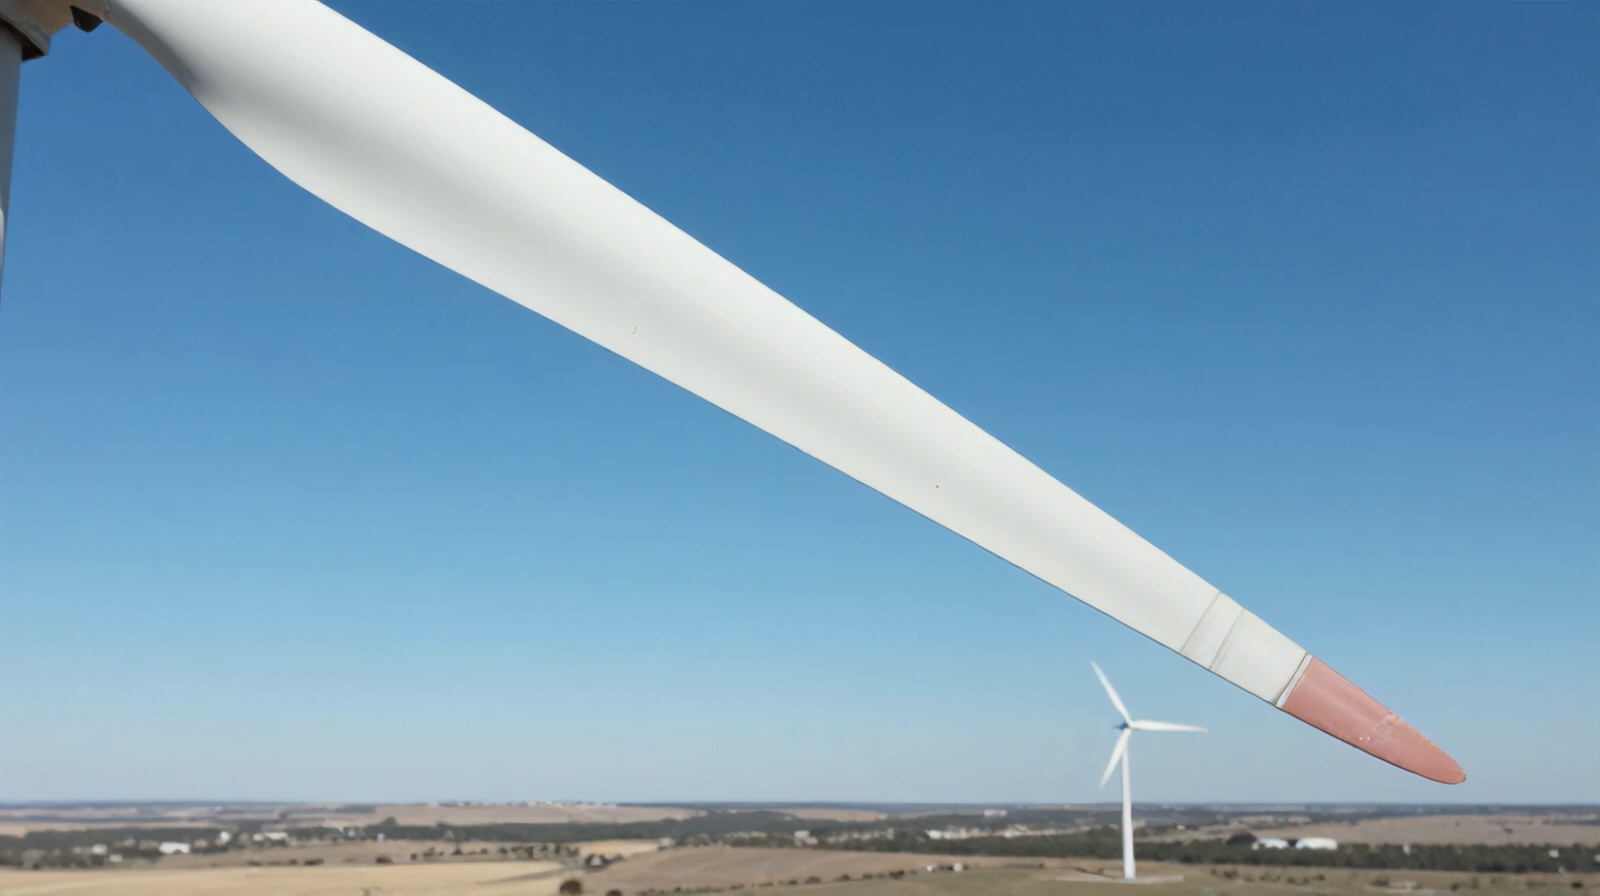
The most common blade defect. Raindrops and particulates impact the leading edge at 80–100 m/s tip speed, gradually eroding the gelcoat and then the fiberglass laminate. LEE is classified by severity: surface contamination (clean, no loss), erosion Grade 1 (surface roughness, no substrate exposure), Grade 2 (pitting, substrate visible), Grade 3 (deep pitting, delamination risk), Grade 4 (laminate loss, structural concern). A Grade 3+ leading edge increases blade drag and reduces annual energy production (AEP) by 2–5% per blade.
Transverse or longitudinal cracks in the blade surface indicate fatigue loading or manufacturing defects. AI models distinguish surface cracks (cosmetic, sealant repair) from structural cracks (penetrating the load-bearing laminate, requiring engineering review). Crack length, width, and orientation are measured by AI from the imagery and reported with GPS blade position for precise field location during repair.
Texas wind farms experience significant lightning activity. Lightning strikes create characteristic damage patterns — surface scarring, resin carbonization, and sometimes deep punctures — at the blade tip, where the lightning receptor is designed to intercept strikes. AI models identify lightning damage patterns distinct from erosion or crack damage and flag all struck blades for engineering review before the turbine returns to service.
Internal delamination — separation between fiberglass plies or between the skin and internal structural web — can be detected in surface imagery through subtle surface topography changes (bumps or depressions over void areas) when lighting is at low angles. Thermal imaging adds sensitivity for larger subsurface voids. AI thermal analysis of blade images flags surface topography anomalies that warrant detailed investigation.
Blade root bolt covers, pitch motor covers, and nacelle access hatches are inspected for seal condition, corrosion, and physical damage. AI inspection of these components from drone imagery prevents the slow degradation of weather seals that allows moisture infiltration into the hub and pitch drive systems — failures that cost $50,000–$150,000 to repair.
The tower surface, access door seals, cable entry points, tower flanges, and nacelle cover panels are all documented in the drone inspection mission. Corrosion at tower paint breaks, flange bolt cover cracking, and drainage port blockage are common tower-level findings that drone inspection captures systematically where visual inspection from the ground cannot achieve sufficient resolution.
Drone inspection data becomes significantly more valuable when correlated with the turbine's SCADA performance history. Here's how the integration works and what it reveals.
Texas's wind generation is concentrated in two primary regions, each with distinct inspection challenges.
Turbines in West Texas face extreme dust and particulate erosion from sandy soil conditions. LEE progression is faster here than in coastal or agricultural areas. Inspection frequency should increase to every 6–9 months for turbines in high-dust zones. Sandstorms that reduce visibility to near zero are common in spring — scheduling inspections in fall (October–November) avoids the worst erosion season and captures the maximum accumulated summer damage before winter downtime windows.
The Texas Panhandle experiences heavy hail and severe thunderstorm activity, particularly in May–June. Post-storm drone inspection of all turbines after significant hail events (defined as hailstones > 3/4") is essential for identifying impact damage before it propagates. Insurance claims for hail damage on wind turbine blades require documented inspection evidence — Ceezaer's reports are formatted to meet the documentation requirements of major renewable energy insurers.
Coastal wind projects near the Gulf face salt-spray corrosion on metallic components and accelerated gelcoat degradation from UV exposure combined with salt particulate. Annual drone inspection with corrosion mapping of all above-ground metallic components is standard practice for coastal Texas projects operating under 20-year PPAs.
Drone AI inspection applied to Texas's other major energy infrastructure asset class.
Complete guide to thermal drone inspection for solar assets — Texas's fastest-growing energy sector.
The AI foundation behind automated defect classification in drone inspection systems.